Chrome DevTools is a set of web developer tools built directly into the Chromium browser.
DevTools can help you diagnose problems quickly, which ultimately helps you build better websites, faster.
One of the most important ways of improving site performance is to reduce the size of the files that are being transferred.
Media files are in high priority for optimization, but what about other files such as HTML, stylesheets, and scripts.
Even though a content delivery network(CDN) is a system that uses distributed servers to deliver websites and other web content depending on user’s location and other parameters.
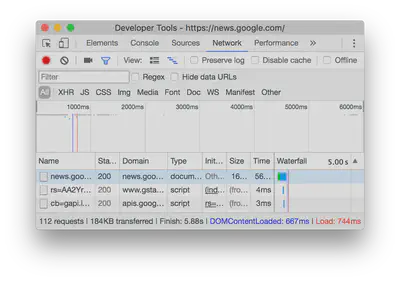
The Network panel(Source: Google Developers)
Essentially, a way of taking a websites static files, like CSS, images, and JavaScript, and delivering them through web servers that are closer to the user’s physical location.
Stylesheets and scripts used for a site, grows eventually large, especially 3rd party libraries. So it becomes necessary to reduce the size of these files?
Combining multiple files, minifying, and compressing them are some of the popular ways for optimizing these files. Then also these files may contain such code that may not be executed on the webpage, so sending only those elements (and files) that are actually needed will help a lot.
Although minifying and compressing are great, but, if we’re compressing unnecessary data, we still end up in the first place.
But how do we came to know what’s actually necessary and what’s not? So we’ll take a look, how much of the CSS and JS files on a page are actually being used & parsed, which in turn help us to decide how much of it might be removed.
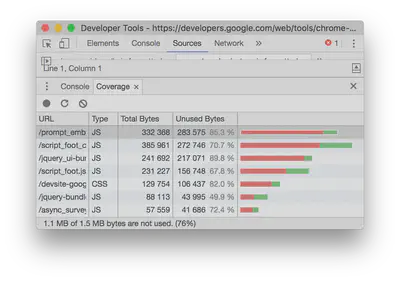
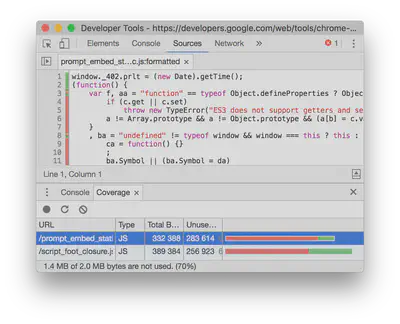
CSS and JS code coverage built into Google Chrome DevTools
So Google Chrome provides a functionality in developer tools to find unused CSS and JS code with the Coverage tab. When you load or run a page, the tab tells you how much code was used, versus how much was loaded. You can reduce the size of your pages by only shipping the code that you need.